The Analytics card on Insights counts visits to your Coming Soon page. It needs no setup — tracking starts the moment your page is live.
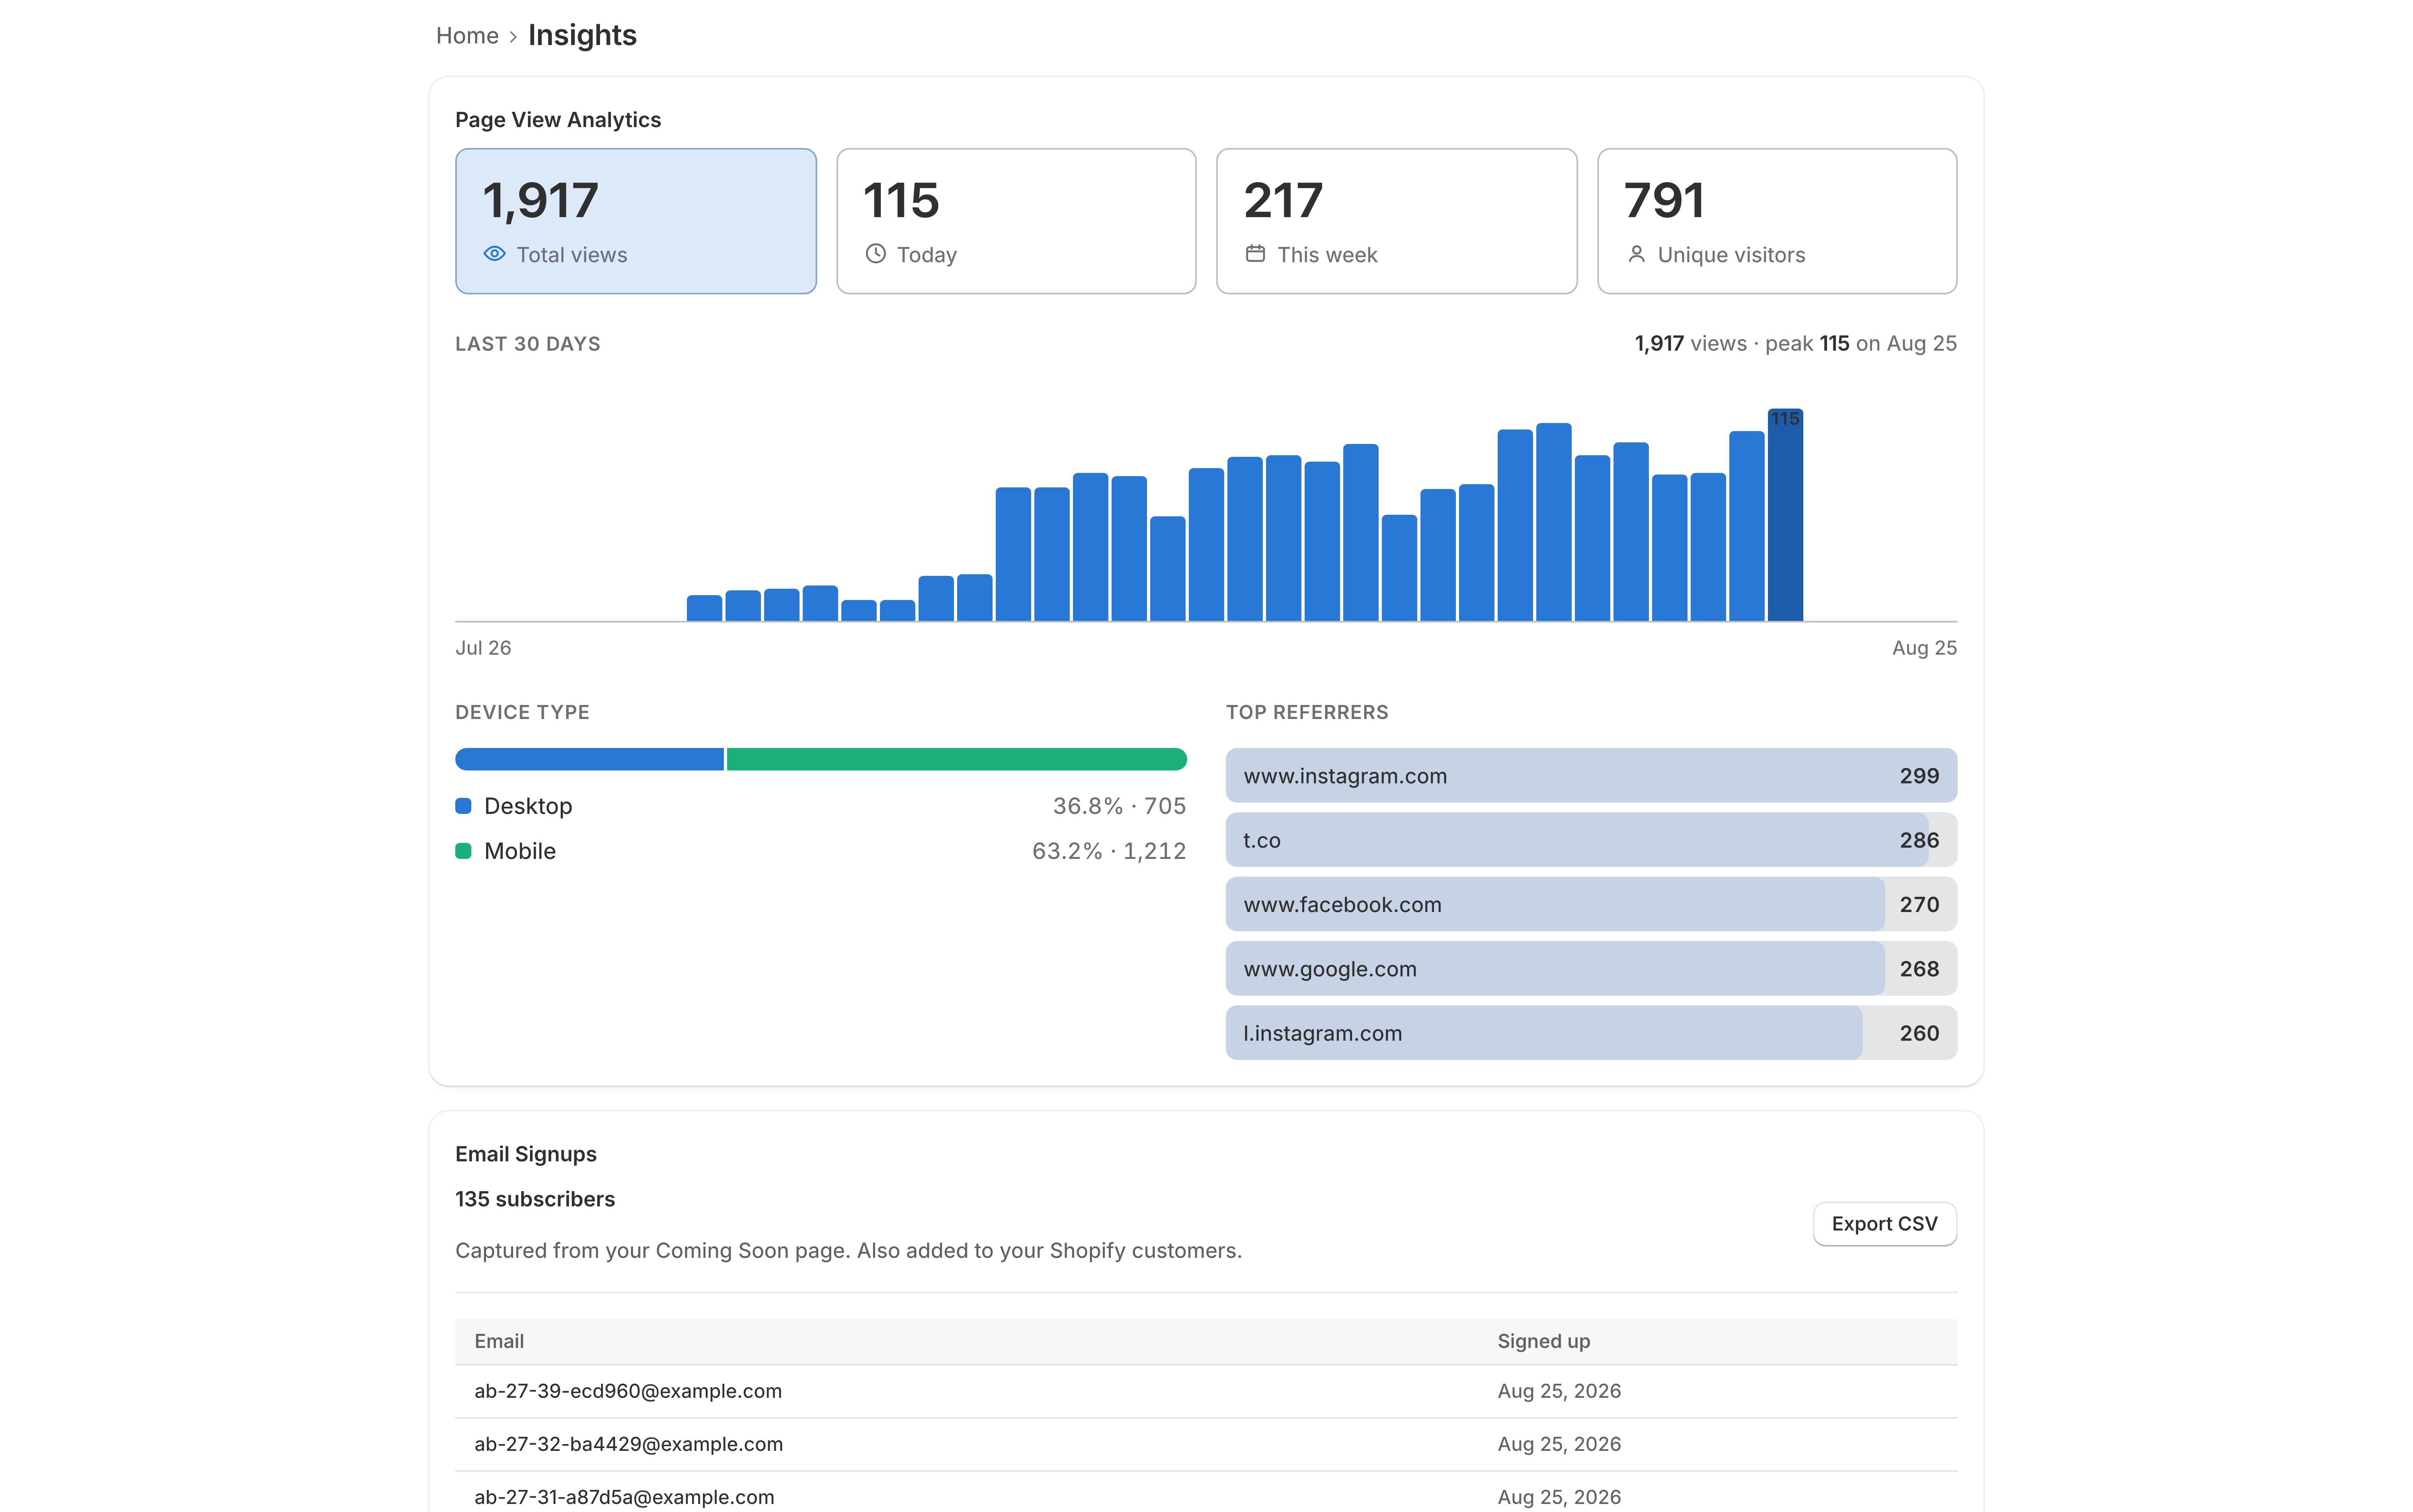
What it shows
| Metric | Meaning |
|---|---|
| Total views | Every view of your page, all time |
| Views today | Since midnight in your store’s timezone |
| Views this week | Since the start of the current week |
| Unique visitors | Distinct visitors rather than page loads |
| Mobile vs desktop | Counts and percentages |
| Top referrers | Up to ten sources sending you traffic |
| Daily trend | Views per day for the last 30 days |
Views vs unique visitors
A visitor who loads the page, refreshes, and comes back tomorrow is several views and one visitor.
Use unique visitors to judge reach and views to judge engagement. If views are much higher than visitors, people are coming back — which for a pre-launch page usually means they are checking whether you have opened yet. That is a good sign.
Top referrers
Where visitors were immediately before your page.
- Direct — no referrer. Typed the URL, a bookmark, a link in an email or a messaging app, or a browser that withheld it. This is often the biggest bucket and it is not a problem.
- Social —
instagram.com,t.co,facebook.com, and similar. - Search —
google.comand other engines.
If you are running paid traffic, judge it here against what the ad platform claims. They will disagree slightly; the platform attributes more generously than a referrer header does.
The 30-day trend
Daily counts for the last 30 days. What to read in it:
- A spike should line up with something you did — a post, an email, a feature. If it does not, check referrers to find out who sent it.
- A decline after a launch push is normal. Pre-launch traffic is bursty.
- A flat line at zero means the page is not being seen. Check it is live before concluding the marketing failed.
Freshness
Analytics is cached for five minutes. A visit you have just made yourself may not appear straight away — wait and refresh.
If you want an immediate signal that something registered, the activity feed is not cached and updates on every page load.
What is not counted
- Storefront pages. This counts your Coming Soon page only. Visitors who came in through an allowlisted URL or past the password never load the page and are not counted here — use Shopify’s own analytics for those.
- Your own visits are counted. There is no admin exclusion. Preview from
/apps/coming-soonsparingly if you are watching low numbers, or expect a handful of your own views in the total.
Analytics and A/B tests
While a test is running, views are also tagged with the variant that served them. Totals here still cover both sides together — the per-variant split is in the A/B card.
Alongside Google Analytics
You can run both. The SEO & Analytics fields on Simple and Duo take a GA4 ID and a Facebook Pixel ID.
The numbers will not match exactly. Different tools define a session differently, and GA is blocked for a share of visitors while this counts server-side. Treat this card as the count of what actually reached your page and GA as your cross-property view.